Transforming Food Production
Bridging the Gaps in Manufacturing Processes
Imagine walking into a bustling food factory, where teams are juggling manual logs, disconnected systems, and delayed alerts. Despite their hard work, they struggle with limited real-time visibility, making it hard to catch issues early, ensure quality, or stay compliant. Waste piles up, schedules slip, and decisions are based on incomplete information. It’s clear that their current way of working creates gaps—gaps that slow down production, increase costs, and put safety at risk. What they need is a smarter, centralized system that brings everything together, providing the insights needed to optimize operations and meet industry standards with confidence.
Team
Itisha Srivastava
Harshita Shenoy
Prashant Bonipella
Tools
Figma
Lovable (AI Frontend)
Jitter
Maze
Roles
Researcher
UI & Motion Design
UX Design
Strategy Design
Cloud-based SaaS platform
ESV : Eat Safe Verified
ESV is a cloud based SaaS platform by Genista Biosciences revolutionizing food safety testing and tracking for the CPG and co-manufacturing industries. It provides a centralized solution for streamlined processes, fostering collaboration, real-time communication and automated corrective actions. It integrates manufacturing execution, quality assurance, environmental compliance, product testing, and supply chain management, enabling end-to-end operational visibility and optimization for food manufacturers.
_edited.jpg)


Research & Discovery
We worked closely with ESV’s CMS team, using a combination of contextual inquiries, interviews, and observational studies, we gained a nuanced understanding of each role’s unique challenges and workflows.
We wanted to know
Understand what their day for each role actually looks like
Routine Map
We shadowed their workflows, mapped their routines
Tool Analysis
Digital and physical tools they rely on (or avoid)
Identifying problems
Used contextual inquiry and workflow audits to surface key usability gaps and system friction points.
What we FOUND
01
Breaking Down Silos : Unified Data for Proactive Production Management
Problem
Operators and supervisors found it difficult to get real-time insights into machine performance and production status. The current interfaces were cluttered, unintuitive, and required manual data entry, which slowed response times and increased errors. They often had to check multiple systems or physical gauges, leading to frustration and delays.
“The current system is too cluttered; I spend more time figuring out what’s wrong than fixing it. We need a simple, visual way to see everything in real time.”
Insight
Design a unified, clean interface that consolidates live machine data, alerts, and key metrics—making it easy for users to monitor performance at a glance and respond proactively. A streamlined dashboard improves decision-making and reduces downtime.
02
Empowering Operators: Seamless Control at Your Fingertips
Problem
Setting up or modifying production lines was a manual, error-prone process. Operators struggled with confusing workflows, limited visual guidance, and inconsistent layouts. This made onboarding new staff slow and increased the risk of misconfigured machinery or incorrect assignments.
“I wish I could start or stop the line from my tablet instead of running back and forth to the control panel.”
Insight
Create an intuitive, visual design tool that allows users to easily map out production lines, add equipment, and assign staff responsibilities—making setup faster, more accurate, and accessible even for new team members.
03
Simplifying Setup: Visual Tools for Faster, Error-Free Line Configuration
Problem
Scheduling run times, assigning teams, and managing workflows often relied on static spreadsheets or paper plans. This disjointed process led to miscommunications and delays, especially when production needs to shift quickly.
“Configuring a new line is like assembling a puzzle with no clear picture. A visual layout would make it so much easier.”
Insight
Develop an integrated scheduling module within the platform that offers flexible, drag-and-drop planning, with clear visibility of active lines, staff duties, and scheduled run times—making operations more agile and coordinated.
04
Real-Time Insights: Turning Data into Actionable Intelligence
Problem
Limited visibility into metrics like wastage, OEE, and downtime meant managers couldn’t quickly identify bottlenecks or inefficiencies. Existing dashboards were either too technical or too simplistic, losing the focus on actionable insights.
“I want to see the big picture, not just numbers. A visual dashboard that highlights problems immediately would help us act faster.
Insight
Build customizable, real-time dashboards that highlight critical KPIs with visual cues—charts, color codes, and alerts—helping teams spot issues instantly and prioritize improvements.
05
On-the-Go Compliance: Mobile Checklists and Voice AI for Floor Efficiency
Problem
Operators on the production floor often struggled with performing essential pre- and post-operation checks. The current process required them to carry around paper checklists or return to a desktop station, which was inefficient and disrupted workflow. This led to missed checks, delayed reporting, and inconsistent data entry.
“ Carrying paper checklists or going back to a desktop slowed us down. With the app, I get alerts right on my phone, and filling out the checklist is quick—even with my hands full or in noisy areas.”
Insight
Create a mobile app that delivers personalized task lists to each user, alerting them when it's time for a checklist. Operators can quickly complete pre- and post-operation checks on the floor, improving compliance, accuracy, and speed. To further streamline the process, we integrated an AI-powered voice chatbox, allowing users to fill lengthy checklists verbally—saving time and reducing errors.
User Personas
Understanding different buisness needs

.png)

Dynamic Creation of Production Lines
Easily configure production lines by entering key details, selecting or adding equipment, and designing layouts with drag-and-drop tools. Set up staff roles, shift coverage, and integrations—manual, internal systems, or API-based—for a smart, streamlined, and efficient factory setup.

Comprehensive Line Management & Analytics Dashboard
Every site runs differently—so we offers flexible workflows, adjustable modules, and a dedicated QA Manager to tailor the setup, onboard teams, and adapt to each client’s unique protocols.

Intelligent Production Scheduling
Schedule lines effortlessly by entering start time, duration, staff, materials, and quality checks. Visualized on a Gantt chart, the system optimizes resource use, reduces downtime, and adapts dynamically for smarter production planning.

In-Depth Waste & OEE Analytics
Deep dive into waste and efficiency with dashboards that highlight bottlenecks and improvement areas. Real-time analytics enable continuous optimization, helping managers boost productivity and reduce costs through actionable insights.

Smart Pre-Post Operations Checklists
Import, schedule, and track checklists via SaaS or mobile. Automated notifications keep staff on schedule, past records ensure compliance, and AI voice assistants allow hands-free, quick completion—making quality checks faster and more reliable..
Manufacturing Revolution
Smart Scheduling, API Calls, and AI Tools
We tackled these challenges with a smart production platform that integrates real-time machine data through APIs, features drag-and-drop factory layouts, and supports intuitive visual setup. Smart Gantt-based scheduling and analytics dashboards enhance resource use and performance tracking. AI voice assistants streamline tasks, enabling hands-free compliance. The result is a unified, efficient system that boosts data-driven decision-making and agility.
Information Architechture
Figuring out the structure
.jpg)
_edited.jpg)
_edited.jpg)
_edited.jpg)
-
We refined these wireframes, improving clarity, accessibility, and interaction logic. Simultaneously, we iterated on the information architecture to optimize the arrangement of data and controls, ensuring intuitive navigation and quick access to critical information.
-
We started by breaking down the MES into its fundamental modules—such as production monitoring, work order management, alerts, quality checks, and performance analytics.
-
For each functionality, we created dedicated low-fidelity wireframes focused on specific user tasks and workflows. For example, the production monitoring screens emphasized real-time machine status and workflow visualization, while the work order management screens prioritized task creation, assignment, and tracking.
_edited.jpg)
Iteration and Wireframing
During the development of the MES (Manufacturing Execution System) feature, we adopted an iterative design approach to ensure the final product met user needs and operational requirements. We began by creating low-fidelity wireframes to explore various layout options, focusing on information hierarchy, user flow, and key functionalities such as production monitoring, work order management, and alerts
Turning Insight Into Interfaces

Information architecture

UX Key Features
Drag-and-Drop Layout: Visually arrange equipment and design production lines with an intuitive interface, easy for all users—even without technical skills.
Guided Workflow: Step-by-step prompts streamline setup—covering details, equipment, staffing, and integration—minimizing errors and speeding up onboarding.
Real-Time Editing: Instantly adjust layouts or roles with live previews for a flexible, adaptive setup
Creating Production Line main screens
_edited.jpg)
Create new production line : Basic Details
_edited.jpg)
Create new production line : Adding equipment
_edited.jpg)
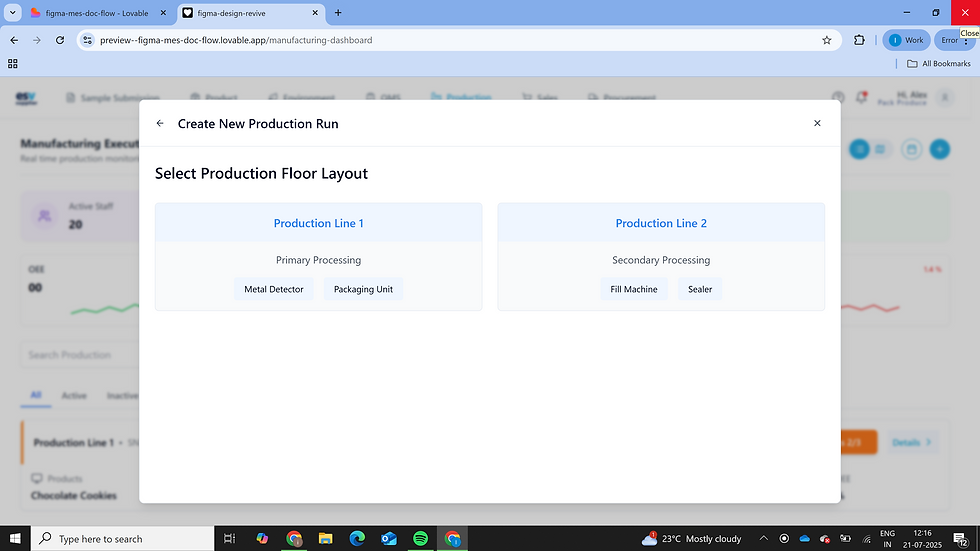
Create new production line : Creating production line layout with added equipment
_edited.jpg)
Create new production line : Integrations (Manual/Internal module/External API
Creating Production Line Prototype

Production Line
Streamlined Setup with Visual Layouts and Flexible Integrations
-
Simplifies setup with a step-by-step interface guiding users through defining line details, equipment, and staffing.
-
Allows users to input basic information, select or add equipment, and create a visual layout representing all machinery.
-
Supports staffing assignments, including roles, shifts, and training needs, with flexible integration options—manual, internal, or API.
-
Enables real-time visualization and easy modifications, ensuring quick and accurate setup of the production environment..
Information architecture

UX Key Features
Interactive Visual Dashboards:
Clear, customizable visualizations of KPIs such as OEE, wastage, and speed, making complex data easily understandable at a glance.
Real-Time Alerts & Notifications:
Instant notifications for warnings or anomalies, helping users respond proactively and minimize downtime.
Comprehensive Equipment & Staff Insights:
Detailed views of equipment health, recent events, and staff status (Active/Inactive), all accessible with a few clicks for quick assessment and action.
Production line details and its analytics main screens
.png)
Quality checks for production line
.png)
Details page : Summary of all equipment and staff
.png)
Analytics screen
.png)
Analytics Screen
More Details, Quality checks and Analytics Prototype

Analytics and details
Real-Time Alerts for Smarter Operations
This feature provides a centralized dashboard that allows users to control, monitor, and analyze all aspects of their production lines in real time.
-
Provides a centralized interface to control, monitor, and analyze production lines in real time.
-
Enables starting, pausing, and finishing lines, with access to detailed equipment and staff insights.
-
Displays key KPIs like OEE, wastage, and quality compliance through visual graphs for proactive decision-making.
Information architecture

UX Key Features
Drag-and-Drop Gantt Chart:
Visual scheduling allows easy adjustments of start times, durations, and dependencies for better planning flexibility.
Smart Inputs & Validation:
Auto-suggestions and validation ensure accurate data entry for staff, materials, and quality checks, reducing errors.
Dynamic Rescheduling & Alerts:
The system adapts schedules in real time, with notifications for conflicts or overlaps, ensuring smooth operations.
Production Line Scheduler main screens
.png)
Production scheduler : Calender view with gantt chart of time slots filled and available
.png)
Production scheduler : Create new schedule, slect production line
.png)
Production scheduler : Schedule details
.png)
Scheduled production line : Details, start/pause run, analytics available
Smart Scheduling Prototype

Intelligent Scheduling
Smarter Production Planning
This feature simplifies planning by allowing users to easily schedule production lines with detailed inputs like start date, duration, staff, materials, and quality checks.
The system visualizes schedules on a Gantt chart, helping optimize resource allocation, reduce downtime, and adapt dynamically to production needs. It empowers users to create efficient, reliable production timelines quickly and accurately
UX Key Features
Interactive Data Visualizations:
Clear charts, heatmaps, and graphs that highlight inefficiencies, waste, and performance trends for quick understanding.
Deep Drill-Down Capabilities:
Users can explore detailed insights for each production line or equipment, facilitating targeted improvements.
Real-Time & Historical Data Comparison: Instant access to current metrics alongside historical data, enabling trend analysis and continuous optimization.
OEE and Waste Dashboard main screens
.png)
OEE Dashboard : Analytics
.png)
Waste Dashboard : Analytics and export options
.png)
Waste dashboard : Per production line details analysis
Waste and OEE Dashboard

Advanced Waste & OEE Analytics
Data Visualization for Production Optimization
This feature offers in-depth dashboards that analyze waste, OEE, and overall equipment effectiveness at a granular level. It provides detailed insights into bottlenecks, inefficiencies, and waste reduction opportunities through visual data, helping managers optimize production and improve operational performance. The system supports data-driven decisions with real-time analytics and historical trend analysis.
UX Key Features for Web
Customizable Checklist Templates:
Easily import and tailor checklists for different operations, ensuring consistency across shifts.
Automated Notifications & Scheduling:
Smart alerts remind staff of upcoming checks, reducing missed or delayed tasks.
Audit Trail & History:
Access past checklists and edits for compliance, audits, and continuous improvement.
Operation checklist (Web) main screens
.png)
Upload pre-operation checklist (Internal docs/import docs
.png)
Completing checklist
.png)
View history logs of checklist

Easy set up for Post-ops checklist
Checklist Prototype (Web)

UX Key Features for Mobile App
Hands-Free Voice Input with AI Assistant:
Use voice commands to quickly fill lengthy checklists, ideal for fast-paced environments.
Instant Notifications & Offline Access:
Stay notified on the go and access checklists offline for uninterrupted workflow.
Quick Edit & Submit: Fast, user-friendly interface for editing and submitting checklists on the floor, minimizing disruption.
Creating Production Line main screens

Explainer screen : Functionalities available on app

Checklist form : Quick navigation available

Calendar view of checklists to complete and view/edit past and future checklists

AI Assistant : Assisting user /completing user tasks
Checklist Prototype (Mobile App)
Completing tasks, calendar view and user profile


AI Assistant (Text and voice)
Operations Checklists
Optimized with AI Voice Assistant
This feature enables users to create, schedule, and manage pre- and post-operation checklists effortlessly via SaaS and mobile app. Automated notifications alert staff when checks are due, and users can access, edit, and review past checklists to ensure compliance. The integration of AI voice assistant allows hands-free checklist completion, streamlining quality assurance processes on busy production floors..
Engineering Handoff
Interactive Prototypes

All core user flows were documented with high-fidelity prototypes, capturing intended interactions and transitions
Edge Case Coverage

Scenarios beyond the happy path—including errors, empty states, and alternate flows—were clearly designed and annotated
Component System

We shared a clean, scalable component library with detailed variants, states, and usage rules to support efficient development.
Release Notes
.png)
Each design file was accompanied by clear release documentation, outlining user stories, functionality specs, and any conditional logic
Design Audits
.png)
Post-development audits were conducted to ensure alignment with the intended experience and polish for final delivery
Lovable AI Integration
.png)
The final designs were also built in Lovable AI as interactive front-end mockups, enabling early user feedback before backend integration
Us In Numbers
Building on this momentum, we’re focusing on deepening system intelligence and expanding capabilities:
-
Predictive Maintenance: Leveraging AI to forecast equipment failures before they happen.
-
Integrated Supply Chain Analytics: Connecting production data with inventory and logistics for end-to-end visibility.
-
Enhanced User Personalization: Custom dashboards and workflows tailored to individual roles for greater efficiency.
-
AI-Powered Optimization: Using machine learning to suggest process improvements and resource allocation.
-
Mobile-First Enhancements: Further refining mobile interfaces with smarter notifications and offline capabilities.
35%
Feature Adoption Rate
Users are engaging with advanced features like AI voice assistants and analytics dashboards more readily.
22%
Boost in User Retention after 3 Months
New feature and value keep users coming back
78%
Reduction in Support Tickets Related to UI/UX Issues
This feature had simpler navigation and visual cues lead to fewer user errors
89